I’ve been dreading this issue. Ever since AI moved beyond drawing celebrities as kids and into the world of weather forecasting, I knew I’d have to write about it. But it’s a vast, nuanced topic that requires actual thought. I’d much rather write another piece about rainbows, hit send, and take a nap.
But, alas, the latest issue of the journal Weather and Forecasting has a doozy of an article that demands attention. The authors engaged in a meteorological battle royale: Google’s AI forecasting model vs. two of the most popular physics-based forecasting models.

Prêt-a-Porter
Weather forecasting models are computer systems designed to predict the future. But instead of relying on the Psychic Friends Network or a Magic 8-Ball, they’re grounded in real-world data. The type of data they use and how they analyze it differentiates one model from another.
In meteorology, numerical weather prediction (NWP) models are the current gold standard. These models ingest historical and current weather data and apply complex mathematical equations rooted in the physics of atmospheric science. They require enormous amounts of data and computing power; the most advanced models take hours to run on some of the world’s most powerful supercomputers.
Artificial intelligence–based weather prediction (AIWP) is a new approach emerging from the recent revolution in AI technology. These models use machine-learning and deep-learning strategies to identify patterns in historical data and apply them to current situations. They rely less (if at all) on simulating atmospheric physics. Because the underlying math is less computationally intensive, AI models can generate forecasts much quicker and with significantly less computing power. Instead of a Jack Black, they can get by with a Jason Segel.
D-D-D-D-Don’t Believe the Hype
In the past couple of years, researchers have published numerous papers proclaiming the superiority of AI-based weather prediction. Many—though not all—of these papers appear in high-quality journals and undergo peer review, meaning they meet the community’s standards for methodology and analysis. Some of these models have also been released publicly, allowing other scientists to attempt replication. So far, so good!
However, the hype train is rarely slowed by reality. When I worked in astronomy, it was a running joke to bet on when the next press release would announce the discovery of an Earth-like planet or the moment Voyager 2 would "finally" exit the solar system. Both seemed to happen annually for decades. The reason is that one can define the solar system boundaries, or even what an Earth-like planet is, in many different ways.
Meteorology faces a similar challenge. We have a near-infinite array of variables that can be used to compare forecasts, giving researchers the flexibility to highlight whichever ones make their model look best. This is known as positive results bias, and one way to combat it is through pre-registration: publicly defining your methods and evaluation metrics before running the study. But that takes guts—and most scientists aren’t doing it yet. As a result, we have many papers describing Generic Model X as superior to Generic Model Y, because they can selectively report outcome variables (moving the goal posts). Yes, they may perform better in the areas discussed—but what about the ones that aren’t mentioned? Did the model perform worse there? Were those variables even analyzed? So take model competitions with a grain of salt.
AIWP models show immense promise. But they are still new and researchers report some limitations. First, their spatial and temporal resolution is generally coarser than that of NWP models, making them less useful for specific, localized predictions. Additionally, AIWP outputs tend to focus more on general atmospheric variables (ex: temperature, humidity, and wind) rather than the more impactful phenomena people are typically interested in (ex: precipitation, cloud cover, and wind gusts). Since the former often drives the latter, it’s easy to imagine that the best approach might be to combine the strengths of both AI and NWP models. But that won’t make for a fun press release.

The Research
A research team led by Jacob T. Radford at the Cooperative Institute for Research in the Atmosphere and NOAA compared a leading AIWP model with two leading NWP models on many real-world weather variables associated with precipitation. They published their results in the journal Weather and Forecasting.
The researchers selected Google’s open-source GraphCast as the AIWP contender because it is one of the more mature options currently available. It was recently updated to include greater detail in precipitation forecasts and offers increased transparency in its underlying processes, such as access to model weights.
For the NWP contenders, the researchers chose the Integrated Forecasting System (IFS) and Global Forecast System (GFS) - two leading global NWP models used for medium-range forecasting. The IFS is developed by the European Centre for Medium-Range Weather Forecasts (ECMWF) and is widely regarded as one of the most accurate models. The GFS, produced by the U.S. National Weather Service (NWS), is another well-respected global model that runs more frequently and is freely available to the public.
Kissin’ Cousins
The field of battle was records of precipitation data across the contiguous United States, drawn from existing ERA5 and NCEP/EMC Stage IV global datasets. These sources provide gridded precipitation estimates based on rain gauge measurements, radar data, and internal modeling techniques.
Now here’s where it gets a little weird. The GraphCast model can be improved by training it using data from the GFS or IFS datasets. But they only used the data itself, not the physics-based predictions from the GFS or IFS models. As a result, there are two GraphCast outputs to analyze: one initialized with GFS data and one initialized with IFS data.
The Judges’ Scorecards
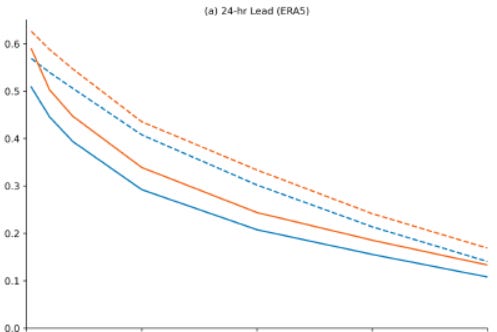
The two GraphCast AIWP models were more accurate across most measures, particularly when initialized with ERA5 data. One way the researchers evaluated this was by comparing the Equitable Threat Score (ETS), which measures how well a forecast matches observed events while adjusting for hits that could occur by chance1. ETS compares the number of correct forecasts (hits) to the total number of forecasted and observed events, minus the number of matches expected randomly.

However, in some areas, the NWP models did better. GraphCast tends to overestimate the frequency of light precipitation and underestimate the frequency of intense precipitation. In general, GraphCast’s advantage seems to be associated with better accuracy in predicting where precipitation falls as opposed to how much.

One of my favorite science writers is Alex Hutchinson, an endurance athlete with a Ph.D who writes books and cool articles like these. He does a terrific job of explaining recent research in the field of athletic performance, with a focus on endurance sports such as marathons. I’ve read him for years and have noticed a few common threads in his articles: (1) the best results come from what works for you, and (2) the differences between various tested conditions are usually small and often only applicable in specific conditions.
This paper echoes that 2nd point. It’s not about one-model-to-rule-them-all and more about taking what works best among the models and combining them. In this case, forecasters can use GraphCast to predict where it will rain and IFS/GFS to predict the intensity of the rain. Together, we have a better forecast for everyone.
The results remind us not to get caught up in the hype of a new toy, but also not to ignore progress when it stares you in the face.
And Now for Something Completely Different
The MLB baseball season is almost a month in. Forget pennant races, this is one of the most exciting times of the year. There’s enough data to get an idea of who the good teams will be, but not enough to dash the hopes of… say, White Sox fans.
The impact of weather conditions on baseball is a well-studied field going back decades. But it’s showing no sign of slowing down. Here are some interesting recent studies:
This paper found that fans would pay almost $3 more for a ticket to a game under pleasant temperatures versus extreme temperatures.
This paper found that Tommy John (UCL) injuries2 are more common among college and high school pitchers in warmer climates, and it’s not because they pitch more often.

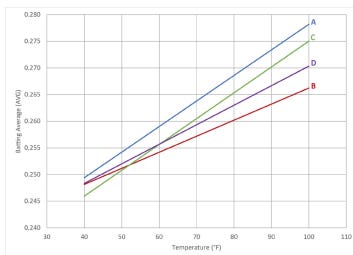
This paper found that players born in cold, arid climates tended to hit for less power when playing in hot temperatures as pros.
Baseball truly is a multidisciplinary sport. These articles are from journals in the fields of Geography, Orthopaedics, and Economics.
We acknowledge additional contributions from Chris Nabholz and Beth Mills. We are grateful for a grant from Lockheed Martin to support this newsletter.
Our archive of WWAT articles is here.
During the preparation of this work, the author(s) used ChatGPT-4o in order to copyedit text. After using this tool, WWAT’s author(s) reviewed and edited the content as needed and take(s) full responsibility for the content of the publication.
For example, if you are answering a multiple-choice question with four options, you have a 25% chance of getting it right by simply guessing. So, if 50% of the respondents got it right, you want to account for the fact that many of them could have guessed. That gives you a better idea of what percentage of people actually knew the answer. The answer is about 33%. x+0.25(1−x)=0.50
A serious elbow injury that was once career-ending but now typically requires about a year of recovery.


Thank you for this article. As a now-retired federal government employee, my division would occasionally be contacted by companies pushing their new AI weather forecasts, saying they were superior to the physics-based models we used. But when pressed they 1) wouldn't show us the data they used; 2) would only provide vague statistics on basic items like temperature; and 3) stammered and finally admitted that AI couldn't yet predict the things we really needed like thunderstorms, turbulence, icing, winter precipitation, etc. AI has lots of promise but beware of the overselling going on right now. Good job pointing that out.
Thanks for this post, Aaron. We can't stop the AI train, so it really does pay to understand how it works in the area of atmospheric science. I guess my concern is that weather prediction will become totally privatized, when history has shown that the best way to approach forecasting is by collaboration: private, public, military, and even amateur weather watchers. I hope that doesn't go away, but we'll see...