


Wet Bulbs and Stickiness
Wet Bulbs and Stickiness
It's the heat AND the humidity - but mostly the humidity

Scientists have to define things. It’s the first step in measurement. For better or for worse, they are probably second only to attorneys on the pedant scale.
Everyone knows that 90°F in low humidity hits differently than 90°F in high humidity. But can we measure that difference? More importantly, can we determine how much is due to heat and how much to humidity1?
New research suggests yes to both questions. And it’s important because establishing a common definition will greatly simplify and enhance future research on a topic that for some can literally be the difference between life and death.
It’s Wet and It’s Dry

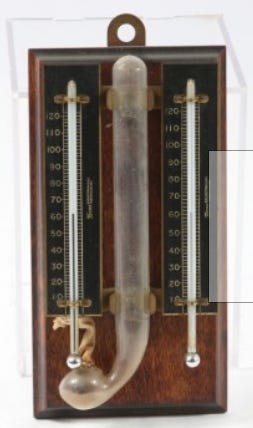
Wet bulb temperature is a thermodynamic concept referring to the lowest temperature that can be reached under current atmospheric conditions by evaporating water into the air. It was originally measured using a thermometer with its bulb wrapped in a wet cloth, hence the name. As water evaporated from the cloth, it absorbed heat from the thermometer, lowering the temperature reading.
When the wet bulb temperature is close to the actual air temperature, it indicates a high-humidity environment where evaporation (and therefore cooling) is less effective. This is particularly important in assessing human tolerance to heat, as it influences the effectiveness of sweating to cool the body. At very high air temperatures, even a moderate amount of humidity can cause heat stress.
The opposite of wet bulb temperature is dry bulb temperature, which comes as described. It’s the temperature reported when the thermometer’s bulb was not wet. This is mostly what people refer to when they simply talk about “temperature”.
Various methods have been proposed to measure the difference between how low and high humidity heat feels to humans. The most common metric is the heat index2 which represents how the temperature feels to the human body when relative humidity is factored in. Many weather apps and websites have developed their own proprietary measures, such as"RealFeel and “Feels Like”, to account for humidity as well as other variables. Scientists often use their own metrics based on regional weather patterns, which can make global analysis challenging. This fragmentation causes a problem for record keeping and analysis. According to the study’s authors: “This has led to definitions of temperature and humidity dependence that are difficult to compare from one study to another.” (p. 820)
Defining Stickiness
Researchers at Columbia University, UCLA, and the Jet Propulsion Laboratory recently published an article introducing an objective way to measure the relationship between temperature and humidity globally, something they call stickiness. Behold:

T is (dry-bulb) temperature, q is specific humidity, and τ is stickiness3 . Furthermore, it has something to do with this equation4:

They tested the new measure with readings from a variety of regions around the world with climates that are sensitive to humidity, but in different ways. These lucky areas include regions near the Persian Gulf, the Indian/Pakistani border, southeast Australia, and the U.S. midwest. The first two were chosen due to their high heat+humidity, the third due to warm, dry summers and the last due to influence of crop vegetation on local humidity and heat levels.
They found that, relatively speaking, extreme humidity was more influential than extreme heat (emphasis mine):
…extreme humid heat at thresholds sufficiently high to impact human health tends to be humidity dependent that is, associated with relatively large moisture anomalies rather than temperature anomalies. (p. 832)
Stickiness’ contribution to science is that, as a variable, it is not location or time-dependent. One measure of stickiness in one area at one time can be compared to another measure in another area at another time. It becomes a tool for researchers to use global data regarding the relationship between heat and humidity to look for local impacts. For example, data from this showed that elevated areas that are in distinct regions but downwind of mountains (think Kabul or Denver) can experience lower levels of stickiness even on highly humid days.
We shouldn’t always paint humidity with the dank brush of death. Humidity’s relationship with high heat can be bad for people and animals, but it can also be good for plants. Higher humidity can help crops be more heat tolerant, reduce wildfires, and moderate the impacts of drought on vegetation.
And now for something completely different
We started this newsletter in February, so it’s a bit of a surprise to already have an update on an article we published. Such is the fast-paced world of meteorological research.
Back in February, we published an article about the migration of tornado activity from the central US to the southeast (and north in the Winter). On April 30, a new paper was published in the Journal of Applied Meteorology and Climatology, which confirms and expands on those earlier findings. Below is their map of the evolution of tornadic activity between the periods of 1951 - 1985 (top) and 1986 - 2020 (middle).
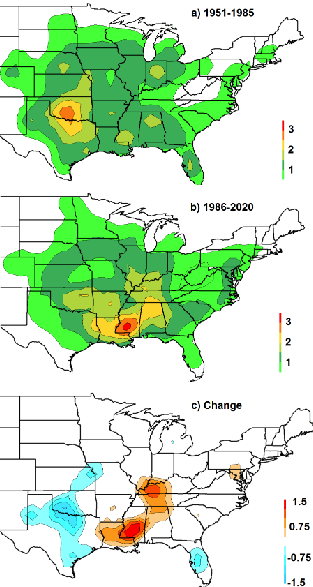
The articles goes into more detail about changes in the type and frequency of tornadoes as well. This is important because one criticism of earlier work is that the evolution was due to changes in the detection and reporting of weaker tornadoes. This new work accounted for that and found the shift in tornadic activity is indeed real.
We acknowledge additional scientific support from Dr. Swarndeep Gill.
Humidity is a surprisingly complicated concept. I plan to dive deep into it in a future newsletter. Until then, here is a summary courtesy NatGeo.
AKA the apparent temperature
and ∂Tτ refers to ∂τ/∂T
The coefficients of the polynomial equation for stickiness are computed numerically by performing a bound-constrained function minimization on an associated mean squared error defined with this equation. Or so they say.