

Calibrating Radars
Tiny snowballs to the rescue

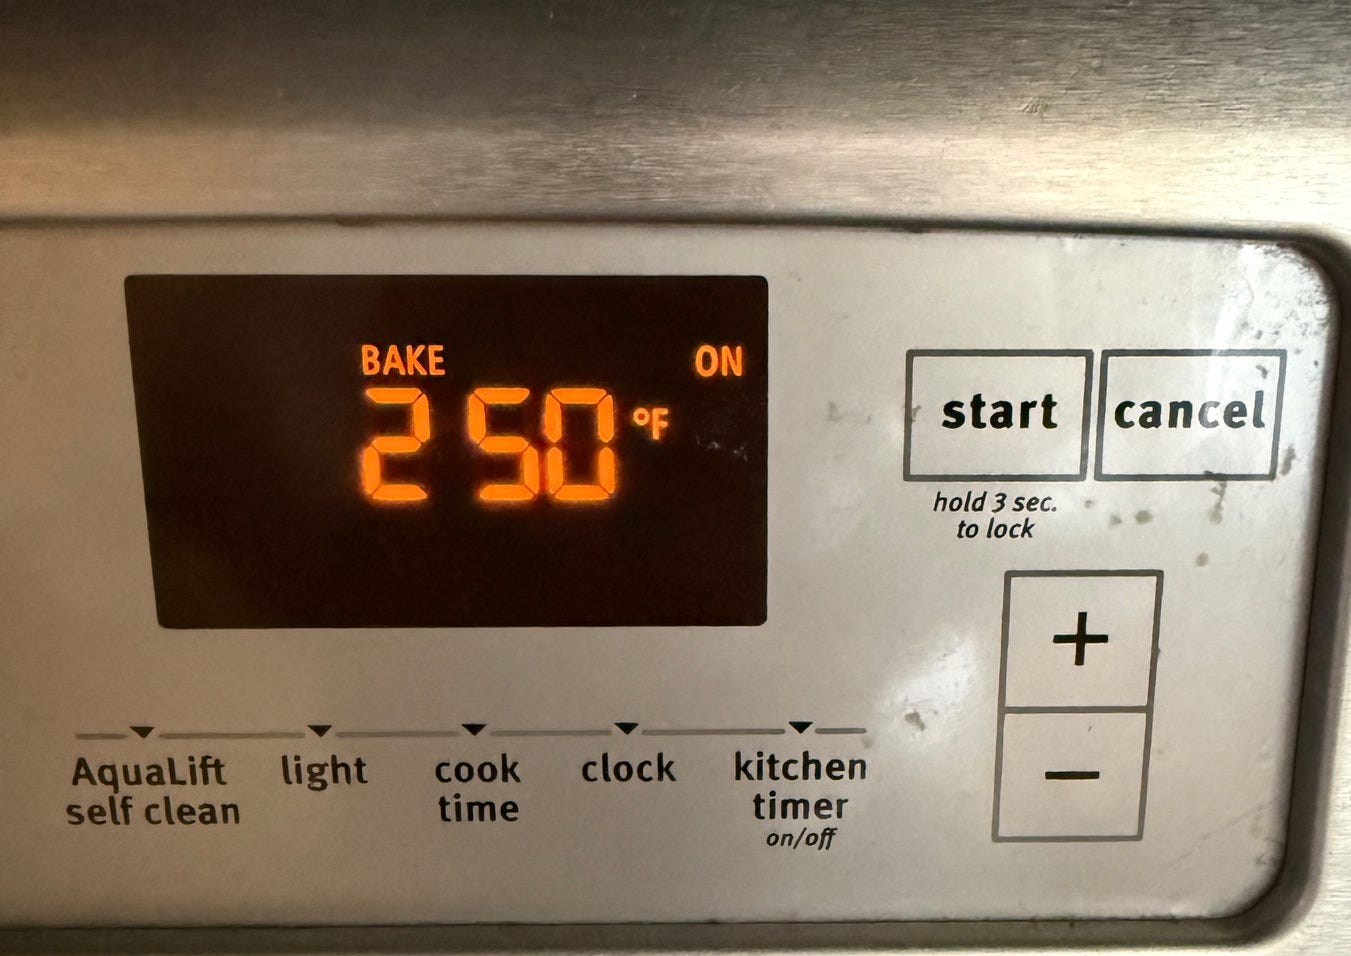
Data lies to us all the time. The question is whether it's an outright lie, like a politician caught with their hand in a cookie jar, or a plausible one, like your oven reporting 250° when it's actually 300°.1
Unlike in some fields like economics, in science this is actually a problem. Science is based on facts and data (usually). The more accurate and precise the data, the better the analysis. And this brings up the wonderful topic of calibration.
Calibration is the process of comparing an instrument’s measurements against a known reference standard to determine its margin of error. It involves measuring the statistical difference between the instrument’s readings and the standard so that this difference can be applied to correct future data. For example, if you place a thermometer in that oven and notice that the displayed temperature runs 25°F too cold, you have calibrated the device; you can then mathematically add 25°F to the thermostat the next time you cook chicken-in-a-watermelon.

Calibrating Weather Radars
Calibrating weather radars can be a challenge. They measure the sky, and we don’t exactly have a reference sky handy. Radar engineers have many alternatives, but none of them work as well as we’d like. The best (light rain and Bragg scatter) can only be used in specific conditions or cannot be used at all (birdbath scans) by the National Weather Service’s WSR-88D2 radars, due to engineering limitations.

The "88Ds" are dual-polarization radars (after a significant upgrade to the original systems about a decade ago). They fire pulses oriented both horizontally and vertically, then compare the two echoes. The difference in strength between them is called differential reflectivity, a.k.a. Zdr. That fingerprint provides an approximate shape of the object, which meteorologists use to determine the type of precipitation (hail, snow, rain, etc.) or even whether it's precipitation at all (birds, debris, explosions, etc.).
A new paper, recently published in the Journal of Atmospheric and Oceanic Technology by J. Hu, P. Zhang, J. Krause, and A. Ryzhkov, proposes a method that measures snow in clouds, which would be more useful since there are often clouds hanging around somewhere in a radar’s field of view.
Measuring Falling Dinner Plates
Freshly grown ice crystals are flat, and as they drift down, they tend to align horizontally, like a sky full of tiny floating dinner plates. To the radar, they look extremely flat, with high and wildly variable Zdr.
But let those crystals fall for a while, and something nice happens. They collide, tangle, and clump into big, fluffy, low-density snowflakes. A fat clump like that tumbles as it falls instead of lying flat, so on average, it looks roughly round. It’s Zdr settles into a narrow, predictable band between 0 and about 0.25 dB. That’s the tell. Dry aggregated snow, “dry” meaning it hasn’t started melting yet, is the reference the radar needs.
Pray tell, where do we find such snow?
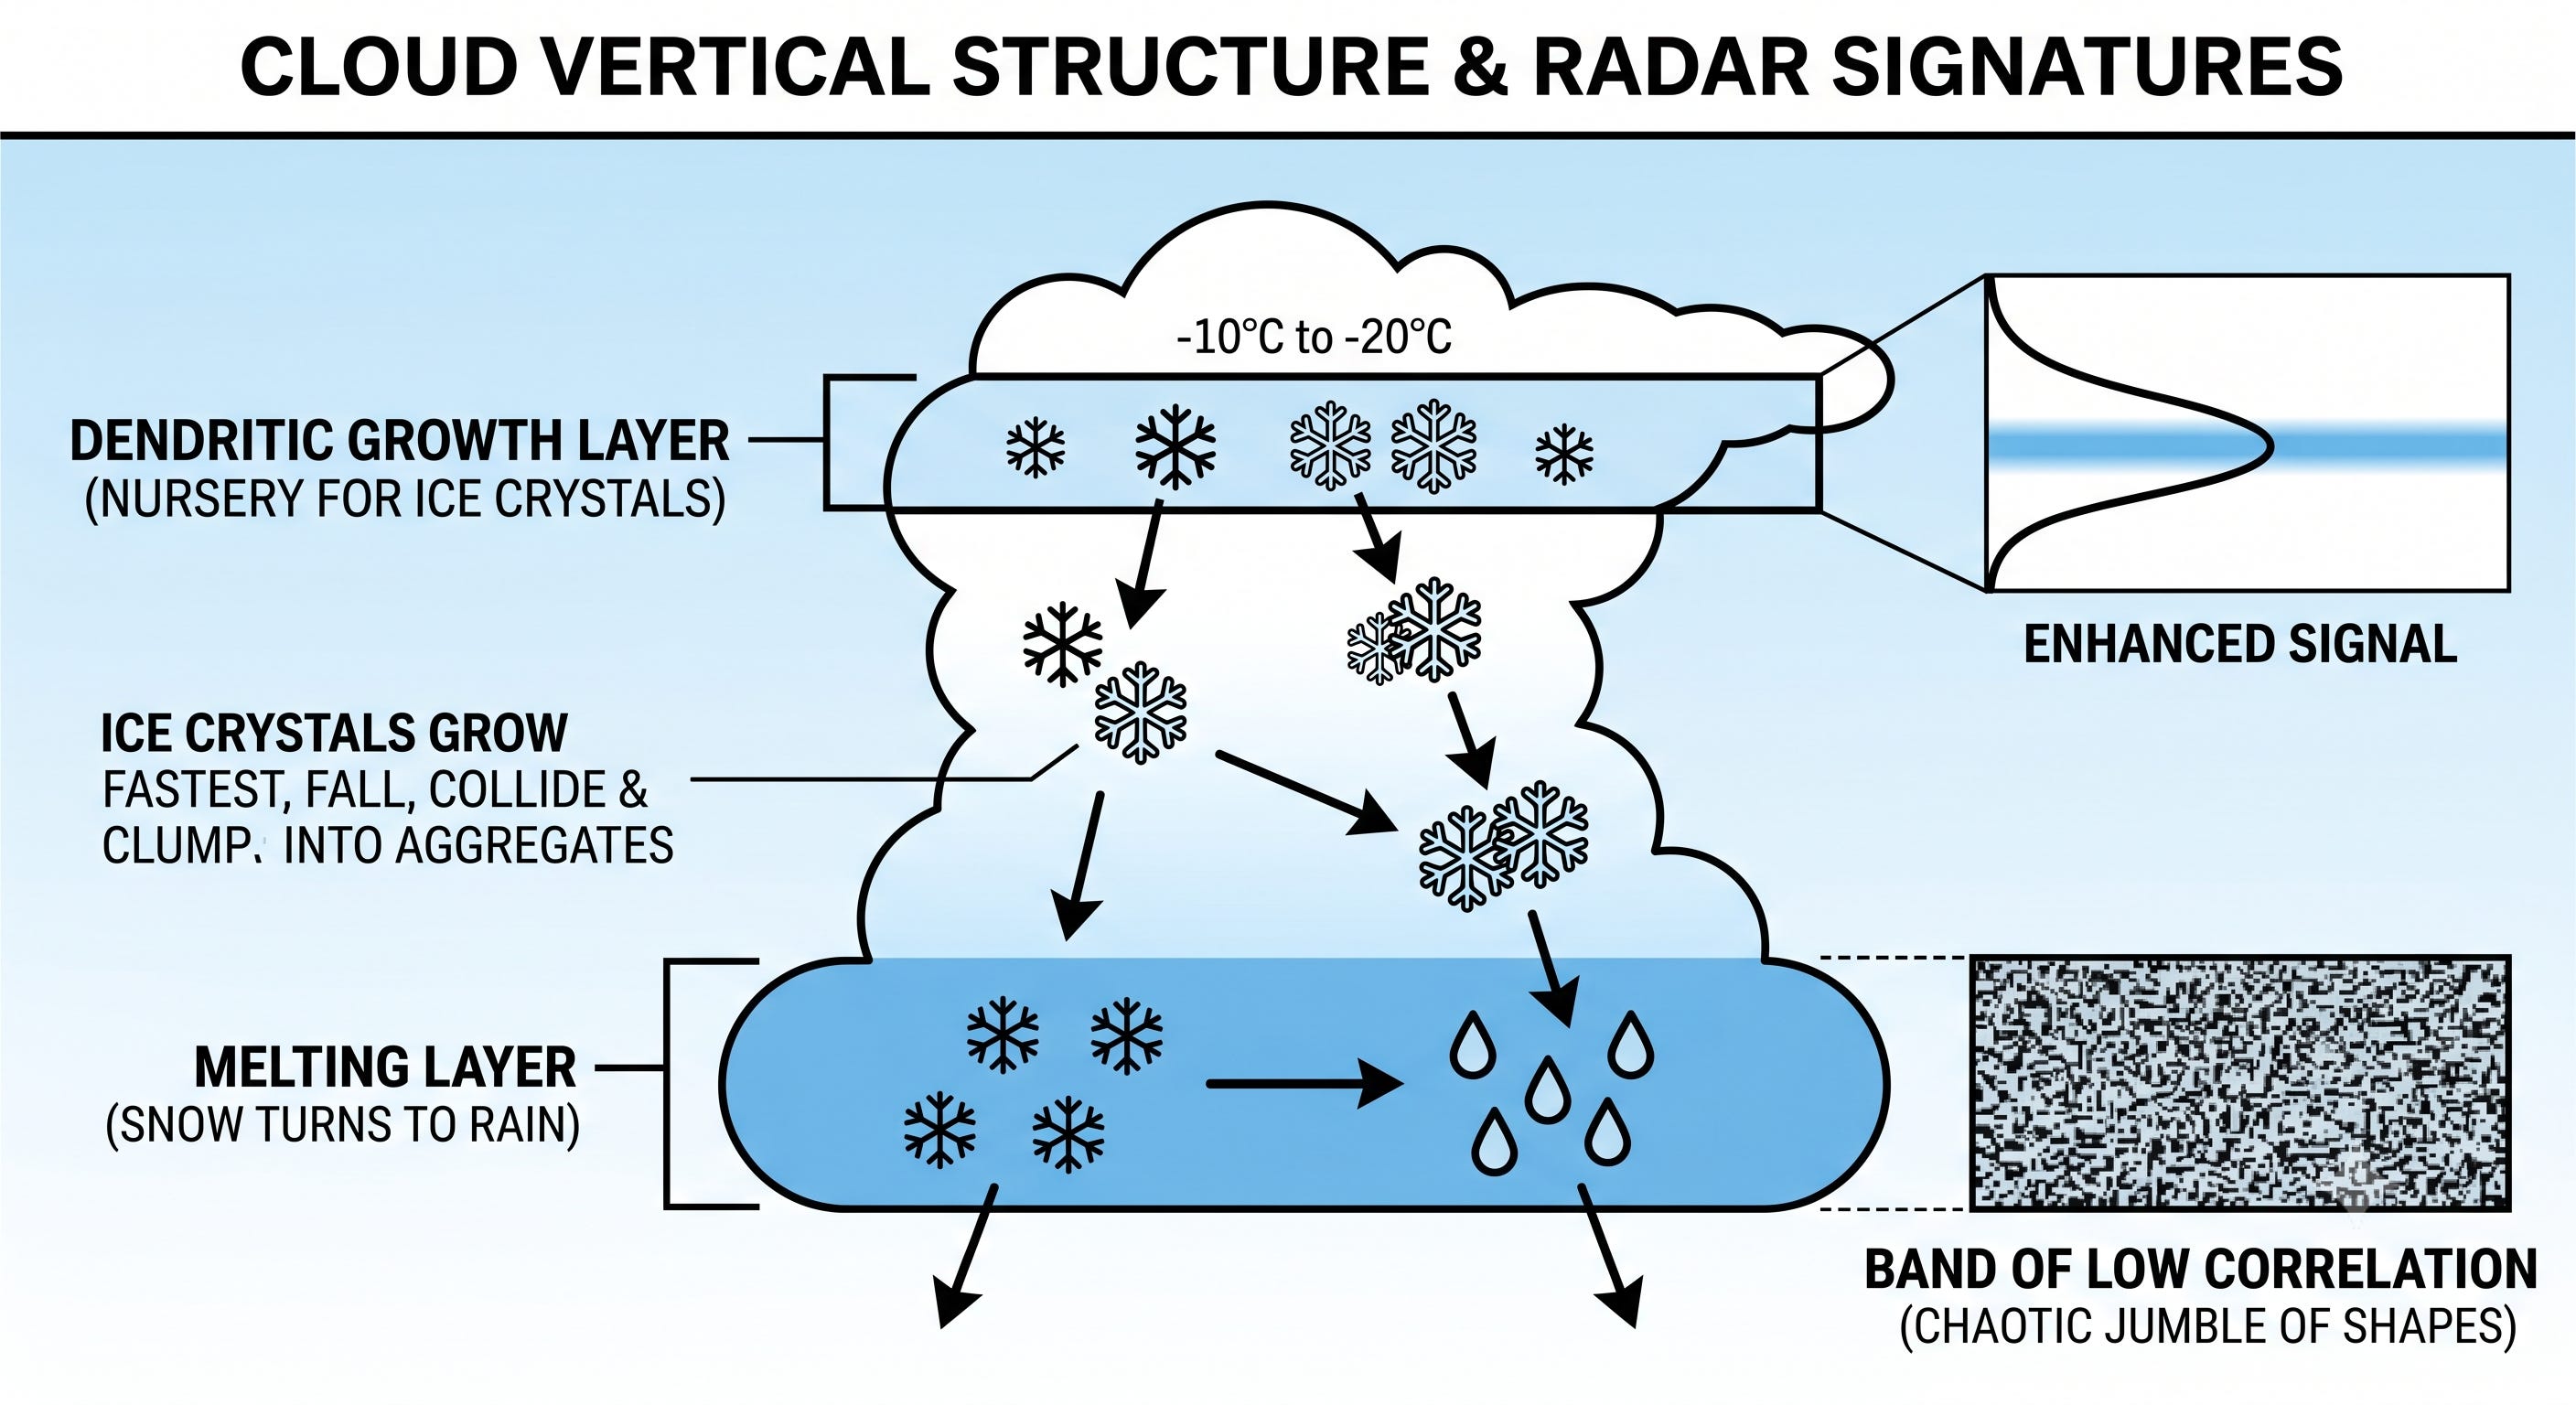
Near the top of a cloud, ofc. Specifically, in the band where temperatures sit around -10° to -20°C. This is the dendritic growth layer: the nursery where ice crystals grow fastest. The radar spots it as a stripe of enhanced signal. As crystals fall out of the nursery, they spend the next stretch of sky colliding and clumping into those fluffy aggregates. Lower down, in warmer storms, sits the melting layer, where snow turns to rain. It appears as a band of low correlation, the radar equivalent of TV static (younger folk will have no idea what I’m talking about), because half-melted particles are a chaotic jumble of shapes.
Dry aggregated snow lives in the sweet spot: below the nursery and above the melting line. The researchers’ main contribution is a new algorithm, QZdrCal, to verify that the layer is present and consists entirely of snow. In the past, similar calibration techniques always assumed the layer existed. So when it didn’t, it returned bad data.
When asked nicely, QZdrCal will test:
Is there enough vertical room between the nursery and the melt for flakes to actually clump together? (It wants at least a kilometer.)
Is there enough storm activity overhead to keep seeding fresh crystals down into that layer?
Is reflectivity increasing on the way down, the telltale sign of flakes fattening up as they collect their friends?
Is the melting-layer static deep enough to confirm that big aggregates really were arriving from above?
Plot Twist: Sometimes it’s cold enough to, you know, actually snow on the ground. There is no melting layer. The system automatically checks for that and, if it’s the case, then it measures the snow all the way down to the surface.
Only when the data passes the checklist does QZdrCal measure the median ZDR in that snow layer, compare it to the value such snow ought to have, and report the difference as the bias.
Testing the Calibration
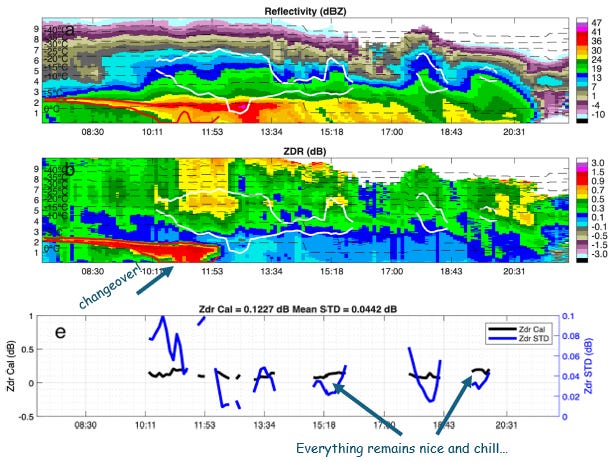
Across a parade of test storms (a warm-season event over Milwaukee, a pure-snow night over Burlington, Vermont, and a messy front in transition over Delaware), the estimates came out stable and tight. The transition case especially so. As one storm morphed from having a melting layer to being frozen all the way down, the algorithm adjusted, and the bias estimate barely twitched. This is exactly what you want, since a given radar’s bias should not change much over the course of a few hours.
The team turned QZdrCal loose on 274 storms scattered across the country. In about one in five, the radar’s ZDR bias came in over 0.2 dB, a known value that lines up neatly with the radar network’s own monthly quality reports. More importantly, the estimates were consistent, with a typical scatter of around 0.06 dB. That is the kind of steadiness that makes an algorithm trustworthy enough to ship.
Zenlike Implementation
And ship it they did. QZdrCal is now built into the operational software that runs the entire U.S. radar network. Previous snow-based calibration routines computed a bias whether or not real aggregated snow was actually present, quietly averaging in a lot of nonsense. QZdrCal’s restraint, speaking up only when it genuinely sees the right snow, is precisely what makes it better. It’s almost zenlike, remaining quiet only when it has something to say.
And Now for Something Completely Different
The NASA emblem has a rich and varied history, famously highlighted by the wars over the meatball logo versus the worm logo. Today, the brand has become immensely popular, generating an estimated hundreds of millions of dollars in annual merchandise sales. Of which NASA gets zilch.


NASA is great and all. But, personally, I love the NOAA LOGO!

I see it on stickers on cars at NWS/NOAA offices all the time. And I want to steal them. Better yet, someone needs to make quality t-shirts out of this logo. It’s government IP, so it’s free (I think). And it can help build the NOAA brand at a time when morale is low. So how about it, apparel industry? RAYGUN I’m looking at you in particular… your weather t-shirt game is already on point. If you make one, I promise not to steal it.
We acknowledge additional contributions from Beth Mills and Chris Nabholz. We are grateful to Lockheed Martin for a grant supporting this newsletter.

Our archive of WWAT articles is here.
During the preparation of this work, the author(s) used Claude Opus 4.8 and Gemini 3.5 to copyedit, fact-check, and draw the cloud diagram. WWAT’s author(s) reviewed and edited the content as needed and take(s) full responsibility for the content of the publication.
Weather with a Twist is published by the American Meteorological Society.
Have you ever tried calibrating your oven’s thermometer precision? Preheat it to something… then once it is there, change the temp to a tiny step above. In my experience, it will immediately beep and report it’s already there. Keep extending the step until it actually starts to heat up. My ovens typically have had a precision of around 25-50°! (and, yes, it changes with temp - the precision diminishes as it approaches 500°)
In WSR-88D, the WSR stands for “Weather Surveillance Radar”, “88” stands for the year 1988, when they were first rolled out, and the D stands for “D”oppler.