To study the atmosphere, we collect data using a wide range of equipment, from simple thermometers sitting a few feet above the ground to geostationary satellites circling 22,000 miles above the surface. There are huge differences in the resources needed to maintain those two tools. With one you can get by with a cheap thermometer, eyeball, and a pen. The other requires a vast network of computers and nerds.
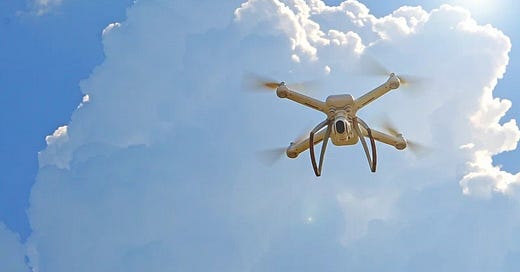
Somewhere in the middle are small Uncrewed Aircraft Systems (sUAS), a type of drone used for environmental data collection.
To many, the word “drone” is charged with associations of warfare and surveillance. It has been used longer as a pejorative aimed at people and tasks that were considered boring and automatic. While many humans love a good semantic debate, sometimes it makes sense to avoid the issue entirely through the creation of a new, more precise term. Hence: Small Uncrewed Aircraft Systems (sUAS).
The power of the pen is the power of creation. Frindle is a book about a boy who makes up words to liven up the day and, in the process, discovers that not everyone likes change.
The sUAS advantage includes reaching remote locations (for example, they can be flown off boats) and are more easily controlled and recovered than balloons. They are safer and cheaper to operate than larger, crewed fixed-wing aircraft. And, after navigating a learning curve, I bet they are fun to fly.
sUAS’s are rapidly growing in popularity. There is even a new professional association, the International Society for Atmospheric Research using Remotely-piloted Aircraft (ISARRA), with its own nifty logo and conference papers with titles like “Synthesis and Validation of Meteorological Parameters from Different RPAS During the ISOBAR Campaigns at Hailuoto” (pdf).
International Society for Atmospheric Research using Remotely-piloted Aircraft (ISARRA)
Respecting Boundaries
sUASs are mostly used to study the atmospheric boundary layer - the bottom layer of the atmosphere that is in contact with the Earth's surface. It’s where most of the “fun” weather happens that directly impacts daily life. Generally, it becomes more active during the day and calms down at night, driven by energy from the heating of the Earth's surface. When calm, the boundary layer can be just a few tens of meters in height. During more turbulent periods (e.g. severe storms), however, it can rise many kilometers. It is an incredibly important concept in meteorology, with over 2.7 million Google Scholar responses, and the highest-ranked publication having over 4,700 citations. The more we know about the boundary layer, the better.
The boundary layer evolves throughout the day. (NikNaks, Own work, [CC BY-SA 3.0], via Wikimedia Commons)
The conditions of the boundary layer are often measured using a suite of instruments that includes ground-based stations, instrument towers, radiosondes, and flying aircraft. The first upper air boundary layer measurements were made with kites.
As with any new technology, scientists want to first compare it to existing technology. In this case, a research team led by Dr. Gijs de Boer at the Cooperative Institute for Research in Environmental Sciences (CIRES) set out to test a wide variety of sUAS technologies.
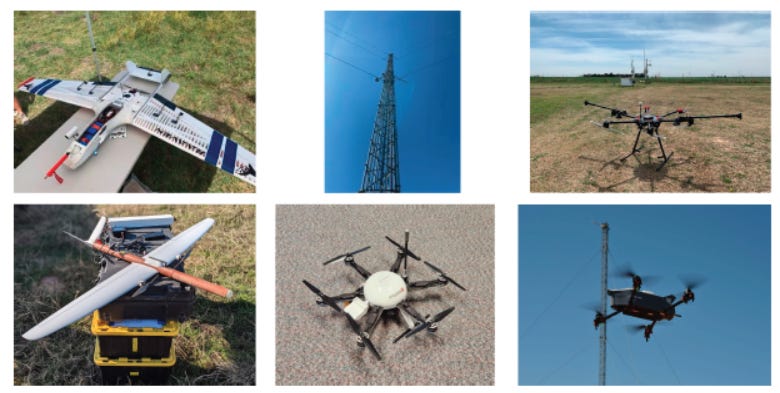
Some of the equipment used in the study (figure from DeBoer, et al., 2024).
To compare data with more traditional methods, they flew over the same area where they also deployed weather balloons and set up instruments atop a 60m tower. They measured many variables, including relative humidity. Interestingly, relative humidity is a surprisingly complex concept. I was going to explain it here, but when I began studying it, my brain melted and ruined my keyboard. The dream is still alive. One day I’ll figure out RH and will report back.
Unpacking a Graph
Y-axis is altitude (m) and x-axis is relative humidity. Different colors represent different devices. Red is a Meteodrone hexacopter, yellow is a Raven remote plane, blue is a Coptersonde2 quadcopter and black is a Black Swift Technologies (BST) 50 remote plane. (DeBoer, et al., 2024)
The figure shows offsets between four of the devices. The Meteodrone consistently recorded the lowest relative humidity levels while the BST 50 recorded the highest, with differences of around 5-10% between them. This type of inter-device difference can usually be addressed through calibration and statistical techniques because it is more or less consistent. However, notice the Meteodrone’s differences with the other devices change with altitude. It was greater at lower altitudes and smaller at higher altitudes. This makes analyzing the data more complicated. We can’t simply shift the zero-point.
Also, notice the wiggles in each line as it moves horizontally. The wiggles reflect measurement variation, which can be real or can be noise. At around 50m there seems to be extra variation with the BST 50 and CU Raven devices, but not as much with the other two. Note those two devices are remote airplanes as opposed to the others, which are copter drones. Maybe there is something about how they fly (i.e. copter propellers may influence the sensors in a different way) that created extra variation at that altitude on that day.
These differences are why having multiple measurement techniques is so important. By combining techniques scientists can use each towards its strengths while also using them as bias checks on each other. That helps determine whether the wiggles are indeed noise or real.
sUAS’s are here to stay and can provide a more flexible approach to collecting data from the boundary layer. But the technology used is new and rapidly evolving, meaning it’s very important to keep testing it and sharing results with the world through publications like this.
And now for something completely different
Weather is the second most popular topic of conversation in Britain. The Lancaster University corpus toolbox, #LancsBox, analyzed over 100 million words taken from “informal speech, fiction, newspapers, magazines, academic writing, and online sources between 2010 and 2020” and found references to weather and climate were the 2nd most talked about subject. This backs up prior research estimating that the British spend over four months of their lives talking about the weather. It’s also of no surprise that it took a British organization to even think of doing such a study.
We acknowledge additional contributions from Dr. Chad Kauffman.
Next week: Frozen lightning


